
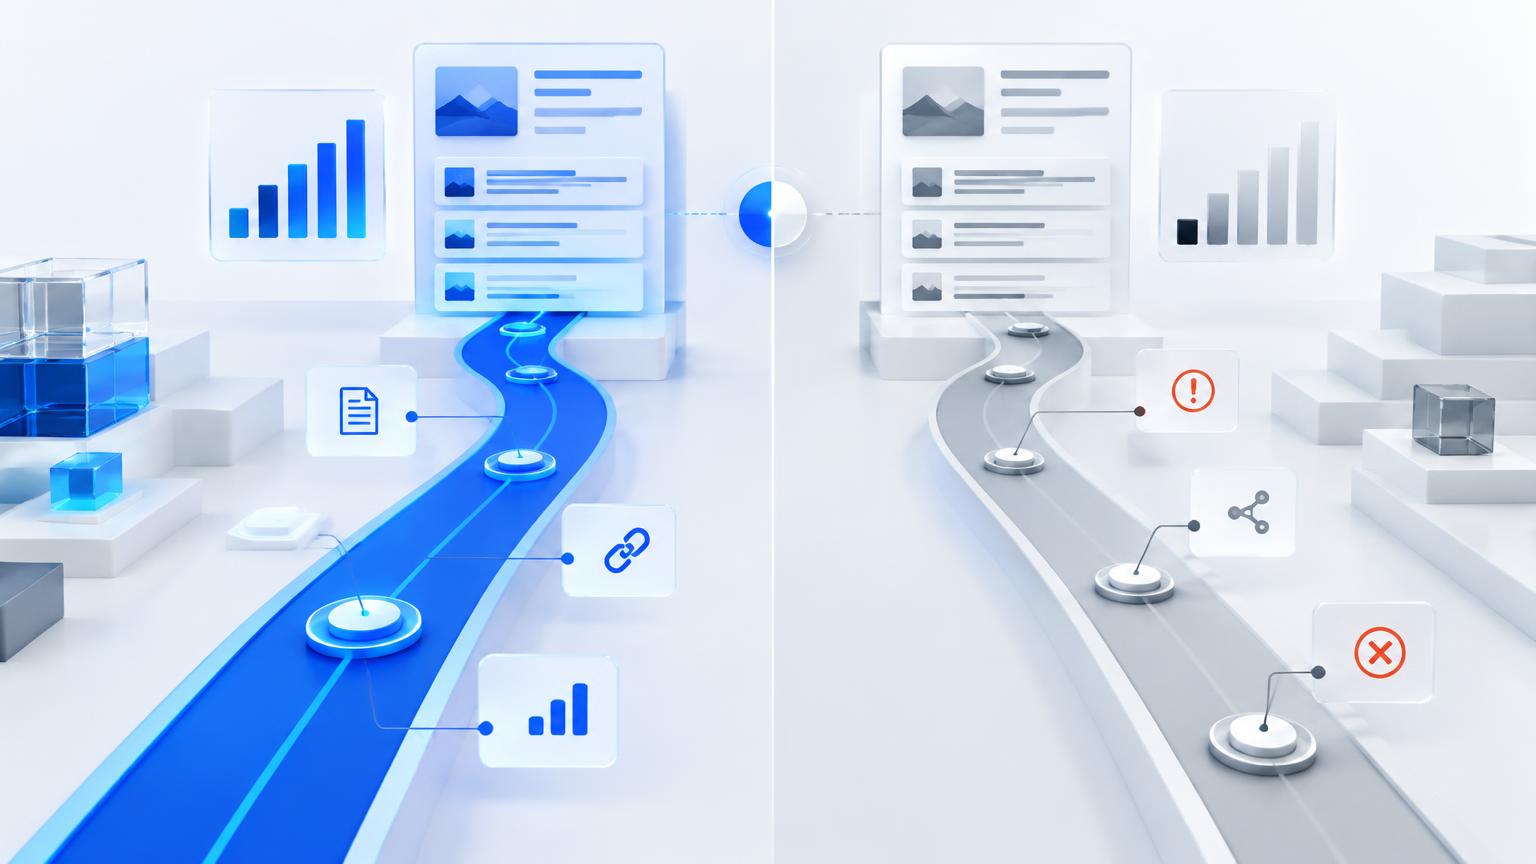
Most AI visibility dashboards stop at the diagnosis a rank tracker would have given you a decade ago: you're behind, here's the competitor beating you, good luck. Win/loss analysis is the layer underneath that, the actual mechanics of why a model chose one source over another for a specific question, broken into signals you can individually check, score and fix. This guide is the full methodology: what to measure, in what order, how to prioritize what you find, and where teams typically go wrong.
What win/loss analysis actually measures
It helps to start with a distinction most teams skip past: a mention and a citation are not the same thing. A mention is when an AI system names your brand in its answer. A citation is when it links to, or clearly draws from, a specific page of yours as a source. You can be mentioned without being cited, and cited without being named as clearly as you'd like. Win/loss analysis, properly done, tracks both, because losing a mention entirely is a different problem from losing the citation to a page that still name-drops you as an also-ran.1
The scale of the gap tends to surprise people the first time they measure it properly. One industry analysis of tracked prompts found the average brand is mentioned in only around 23% of the AI queries relevant to its category, meaning the other roughly three in four are going to a competitor or to no brand at all.2 Win/loss analysis is how you turn "we're behind" into a specific, fixable list: which prompts, which competitor, which signal, in what order.
Before you start: pick the right prompt
Win/loss analysis is only as useful as the prompt you run it against. Pick a prompt that's genuinely high-intent (close to a real buying decision, not idle curiosity), specific enough that a model has to pick a side rather than naming five brands in a list, and one you can plausibly compete on given your current resources. If you haven't already built a prioritized prompt list, that's a prerequisite step, not something to skip. Running a full signal audit against a low-value prompt wastes the same amount of effort as running it against a prompt that actually moves revenue.
A quick sanity check before committing an afternoon to an audit: ask the prompt once, informally, across two or three engines. If your brand shows up as one of several names in a generic list, that's a mention-level gap, closer to a brand-awareness problem than a page-level one. If a specific competitor page keeps getting cited or quoted while yours doesn't appear at all, that's the page-level win/loss problem this guide is built for, and it's worth the full workup.
The complete signal framework
Academic research gives us the clearest starting map here. A 2025 UC Berkeley study, the GEO-16 framework, audited 1,100 URLs behind 1,702 citations across Brave, Google AI Overviews and Perplexity, scoring each page across 16 quality pillars, and found the three most strongly associated with citation were metadata and freshness, semantic HTML structure, and structured data, in that order.3 The same study found the three engines cite pages of measurably different average quality: Brave's cited pages scored highest, Google AI Overviews close behind, Perplexity's cited pages noticeably lower, meaning Perplexity will cite thinner pages than the other two are willing to.3 That's the backbone. Here's the practitioner's version, organized into six categories.
1. Technical & crawlability
2. Structured data & metadata
3. Freshness
4. Content depth & answer clarity
5. Trust & corroboration
6. Engine-specific fit
The six-step manual methodology
Here's the runbook, whether you're doing this with a spreadsheet or a platform.
- 01Confirm the loss with repeated samplingRun the exact prompt five to ten times across a few days, not once. These models are probabilistic; a single run can show a loss that isn't representative, or miss a win that is. Research on prompt sampling has found a single run misses roughly 9 out of 10 of the source URLs a model actually draws on across repeated runs.10
- 02Identify the winning page (or pages)Note every source the model cites across your repeated runs, not just the first one you saw. Different runs sometimes surface different winners.
- 03Score both pages across the six signal categoriesUse a consistent 0–100 scale per signal, ideally with someone other than the page's own author doing the scoring, to reduce bias.
- 04Calculate the gap and rank by severitySubtract your score from the winning page's score for each signal. The largest gaps aren't automatically the most important; that's what the next step is for.
- 05Prioritize using impact vs. effort, not gap size aloneSee the framework below. A 20-point gap that takes an afternoon to close usually beats an 80-point gap that requires a rewrite.
- 06Fix one or two things, then re-sample before changing anything elseIf you change five things at once and the citation flips, you won't know which fix actually mattered. Ship the highest-priority fix, wait two to four weeks, re-run the prompt, then move to the next.
Prioritizing fixes: an impact vs. effort framework
Gap size alone is a bad prioritization signal, since the biggest gap is sometimes the most expensive to close. A simple two-axis framework works better: how much lift the fix is likely to produce, against how much effort it takes.
Quick wins (do first)
Freshness dates, foundational schema (Organization, BreadcrumbList), moving the answer into the first 100 words. Cheap, fast, and they compound across every page once templated.
Big bets (plan for)
Rewriting for depth and specificity, building genuine external corroboration through PR or review-site presence. Real lift, but slower and needs sustained effort.
Fill-ins (batch later)
Minor formatting tweaks, secondary schema types, small technical cleanups. Worth doing, not worth blocking a launch on.
Money pits (deprioritize)
Chasing raw domain authority through link-building alone. Slow, expensive, and the research increasingly suggests brand mentions matter more than backlinks for AI citation specifically.9
| Signal | Typical effort | Typical impact | Quadrant |
|---|---|---|---|
| Visible freshness date + schema | Low | High | Quick win |
| Foundational structured data | Low | Medium–high | Quick win |
| Answer moved to first 100 words | Low | Medium | Quick win |
| Content depth & original data | Medium–high | High | Big bet |
| External corroboration (PR, reviews) | High | High, slow to arrive | Big bet |
| Secondary schema types | Low | Low | Fill-in |
| Pure backlink acquisition | High | Low for AI citation specifically | Money pit |
Common mistakes teams make
- 01Judging a win or loss off a single prompt runThese models are probabilistic. One run can mislead you in either direction.
- 02Treating structured data as a guaranteed leverThe evidence is genuinely mixed. It matters more as eligibility than as a ranking boost for pages already performing.
- 03Analyzing only one engineBrave, Google AI Overviews, Perplexity and ChatGPT cite pages of different quality and fan queries out differently. A loss on one isn't necessarily a loss everywhere.
- 04Confusing mentions with citationsLosing a citation to a competitor's specific page is a different problem from your brand not being named at all. They need different fixes.
- 05Ignoring off-page corroboration entirelyTeams default to fixing their own page and never check what Reddit, G2 or industry press are actually saying, even though branded mentions correlate with AI visibility more strongly than backlinks do.9
- 06Changing everything at onceShip one or two fixes, wait, re-sample, then move on. Otherwise you'll never know which change actually mattered.
- 07Treating it as a one-time projectModels update, competitors publish, and fan-out patterns shift. A win/loss audit from six months ago is a snapshot, not a permanent state.
When manual analysis stops scaling
Manual win/loss analysis works fine for one prompt, checked occasionally. It stops working somewhere around the point where you're tracking more than a handful of prompts across more than one or two engines, because the repeated-sampling requirement compounds fast: a defensible read on a single prompt on a single engine needs somewhere in the range of dozens to a hundred runs to get a reliable margin of error, and that's before multiplying by every prompt and every engine you actually care about.10 Ten prompts across four engines, sampled properly, is already several hundred individual queries to run, log and re-score every time you want a fresh read, and that's before anyone gets around to actually fixing anything.
The honest threshold looks something like this: if you're tracking fewer than five prompts and checking them monthly, a spreadsheet and the methodology above will serve you fine. Past that, particularly once you're trying to track competitors across multiple engines and re-testing fixes on a rolling basis, the sampling volume alone starts eating more analyst time than the fixes themselves. That's the point where the manual version of this guide is still conceptually correct, it's just no longer the fastest path to an answer, and it's worth automating the sampling and scoring so a person's time goes into deciding what to fix rather than running the same prompt for the fortieth time.
A blank scorecard template
Copy this structure for your own audits. Fill in your page's score and the winning page's score for each signal, then calculate the gap and quadrant.
| Signal | Your score | Winner's score | Gap | Quadrant |
|---|---|---|---|---|
| Technical & crawlability | — | — | — | — |
| Structured data & metadata | — | — | — | — |
| Freshness | — | — | — | — |
| Content depth & answer clarity | — | — | — | — |
| Trust & corroboration | — | — | — | — |
| Engine-specific fit | — | — | — | — |
Run this once per prompt, per engine, and keep a dated copy each time you re-audit, so you can actually see whether a fix worked rather than relying on memory.
None of the six categories above works in isolation, and that's worth remembering before treating this as a checklist to blitz through in one sitting. A page can have flawless schema and still lose if it reads as generic and uncorroborated; a page can be thin and still get cited if it's the only fresh, structurally clean source a model can find on an obscure question. The framework exists to make the diagnosis specific, not to guarantee any single fix works in isolation. Run the audit, fix the cheapest high-impact gap, wait, re-sample, and let the data tell you whether the theory held.
Skip the spreadsheet
Ripplix runs this exact signal-by-signal comparison automatically, with repeated sampling built in, for every prompt where you're losing a citation to a competitor.
Get your free AI Visibility Report →- Distinction between AI brand mentions and citations, cited via Dageno AI and Peec AI methodology guides, 2026.
- Texta, analysis of brand mention rates across tracked AI queries, 2026.
- Kumar & Palkhouski, "AI Answer Engine Citation Behavior: Bringing the GEO-16 Framework in B2B SaaS," UC Berkeley / Wrodium Research, 2025.
- AirOps and Kevin Indig, analysis of 16,851 queries and 353,799 pages in ChatGPT's retrieval pipeline, 2026.
- Ahrefs, matched difference-in-differences study of 1,885 pages adding JSON-LD schema, May 2026.
- Ahrefs analysis of 17 million AI citations; Rankscale freshness-gap benchmark research, 2026.
- Content depth and statistical density analysis, cited via Averi.ai, 2026.
- Independent analysis of entity density in heavily cited AI-search content, cited via Discovered Labs, 2026.
- Ahrefs analysis of 75,000 brands comparing branded mention correlation (0.664) versus backlink correlation (0.218) with AI visibility.
- Evertune, comparison of single-sample vs. 100-sample prompt tracking for source discovery, 2026; industry analysis of sampling margin of error in GEO tracking platforms.